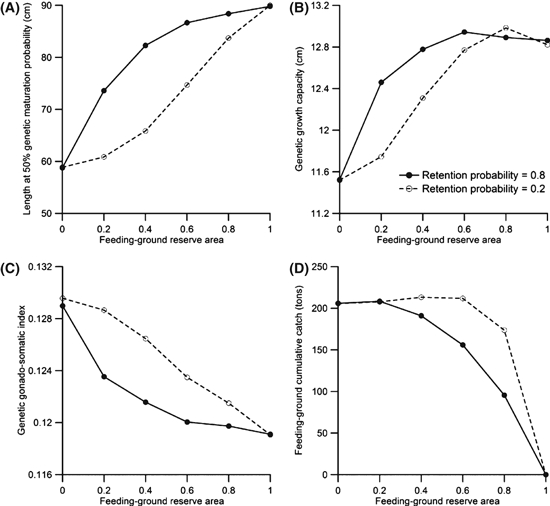
Figure 4.

Effects of movement between the reserve and harvested area on the effectiveness of a feeding-ground reserve. The continuous line corresponds to the default retention probability of 0.8, whereas the dashed line refers to a retention probability of 0.2. All fishing occurs in the feeding grounds (RF = 1) for 100 years with an annual harvest ratio of 0.5. Values shown are means for 30 independent model runs. The legend in panel B applies to all panels.
