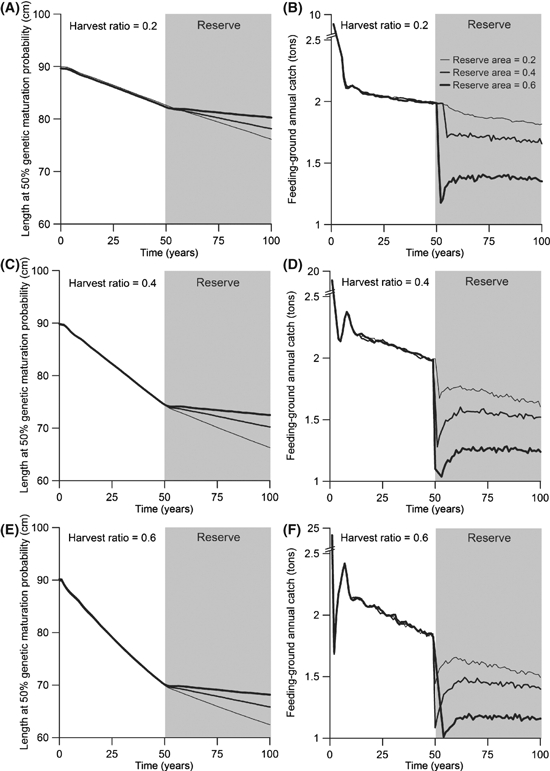
Figure 5.

Effects of fishing for 50 years followed by the creation of a feeding-ground reserve. All fishing occurs in the feeding grounds (RF = 1). Results are shown for three different annual harvest ratios (0.2, 0.4, and 0.6) and reserve areas (0.2, 0.4, and 0.6). Fishing at these harvest ratios occurred before and after creation of the reserve. Reserve area increases with line thickness. Values shown are means for 30 independent model runs. The legend in panel B applies to all panels.
