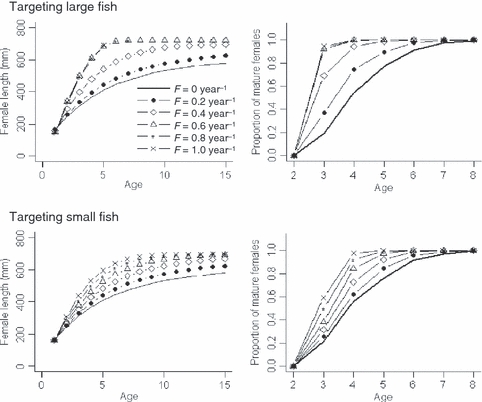
Figure 8.

Final (after 200 years) mean female length-at-age (left) and maturation schedules (age-specific proportion of mature females; right) under deterministic conditions, with two size-limits (targeting large fish versus small fish) and various fishing mortality rates (F = 0, 0.2, 0.4, 0.6, 0.8, and 1.0 year−1; shown in line styles).
