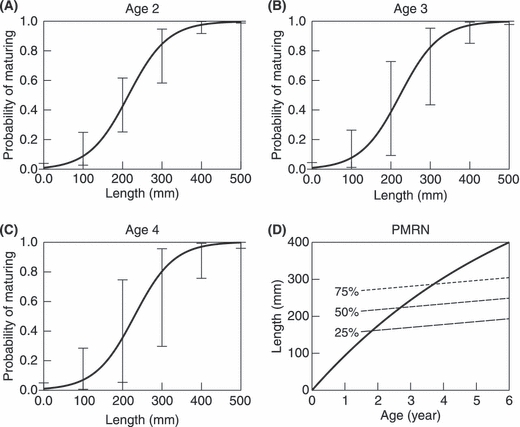
Figure 1.

Empirical probabilistic maturation reaction norm (PMRN) for age and size at maturation estimated for brook charr from unharvested populations. (A)–(C) The continuous curves show how estimated maturation probabilities vary with length for the three age groups most prominent in the data. The error bars connect the 25% and 75% percentiles of the bootstrapped sample. (D) Resultant linear PMRN with constant width. The short-dashed line shows the PMRN midpoint curve lp50,A across combinations of age and length at which maturation probability reaches 50%, while the long dashed and dotted lines show the corresponding quartiles. The continuous line shows the mean somatic growth curve l(A).
