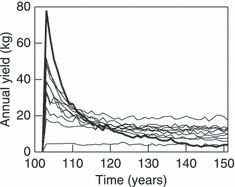
Figure 6.

Illustration of the gradual loss of annual yields (thick curve) throughout the 50-year harvest period when harvest intensity is high (bH = 0.2) and small brook charr are exposed to harvesting (Ms = 0.17) with high selectivity (a = 22.5). Intense fishing of smaller fish initially generates high yields, but causes recruitment overfishing, so that subsequent yields drop. For comparison, results are also shown for 10 other harvest regimes (bH,Ms,a): (0.16, 0.22, 25), (0.18, 0.42, 5.9), (0.19, 0.43, 0.5), (0.02, 0.29, 16.8), (0.17, 0.32, 25), (0.13, 0.18, 14.1), (0.15, 0.26, 19.5), (0.08, 0.34, 14.1), (0.14, 0.18, 11.4), and (0.15, 0.34, 3.2). The other harvest regimes were selected at random uniformly over the range of Ms and bH used in the analysis.
