
Figure 7.
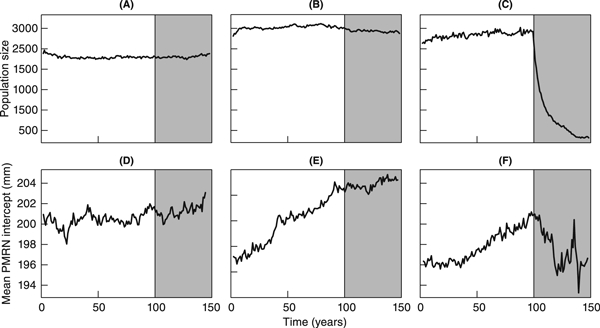
Illustration of changes in population size (top row) and mean probabilistic maturation reaction norm intercept (bottom row) throughout the 100-year initialization period and the subsequent 50-year harvest period. The three columns correspond to three different harvest regimes: (A and D) no harvesting, (B and E) light harvesting limited to larger brook charr (bH = 0.02,Ms=0.29, and a = 25), and (C and F) intensive harvesting extending to smaller brook charr (bH = 0.2,Ms = 0.17, and a = 25). Population sizes in each year were recorded after natural mortality and somatic growth had taken place. Values shown for each harvest regime are means of 25 replicate model runs.