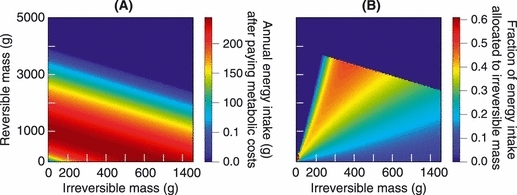
Figure A4.

(A) Annual energy intake and; (B) fraction FA of this intake allocated to irreversible mass, when the resource is at its carrying capacity (K = 1.8 × 10⁹ zooplankton individuals). As the ratio between reversible mass and irreversible mass increases, individuals can allocate a higher proportion of their energy intake to the growth of irreversible mass, while individuals with a low ratio must allocate a lower fraction of their energy intake to the growth of irreversible mass to maintain the maximum ratio between reversible and irreversible mass. The boundaries in (B) arise from two distinct biological constraints. The upward sloping boundary on the left side of the panel demarcates biologically feasible ratios between reversible and irreversible mass. For example, the model does not allow an individual with an irreversible mass of 10 g to have a reversible mass of 3000 g. The downward sloping boundary on the right side of the panel results from the model assumption that for fish with a combined irreversible and reversible mass above a certain threshold (≍4000 g), metabolic costs become so high that there is no surplus energy intake at the end of the year. Panel (B) applies to an individual that matures at a length of 215 mm (corresponding to a mass of ≍30 g), with ρJ = 1.61 and ρA = 2.35.
