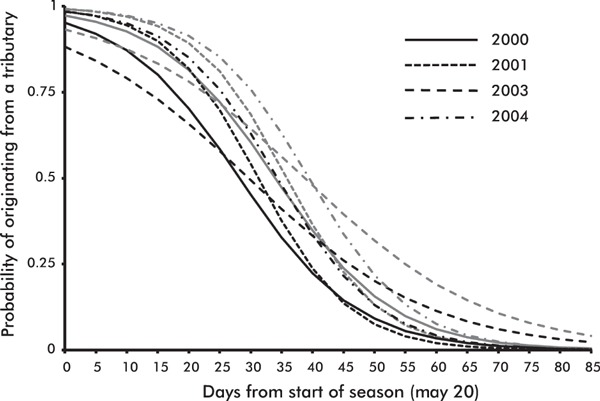
Figure 3.

Probability of an individual originating from a tributary as a function of time (days from start of season May 20) according to the model 2 presented in Table 2. Predicted probability curves are shown for females (gray) and males (black) each year.
