
Figure 6.
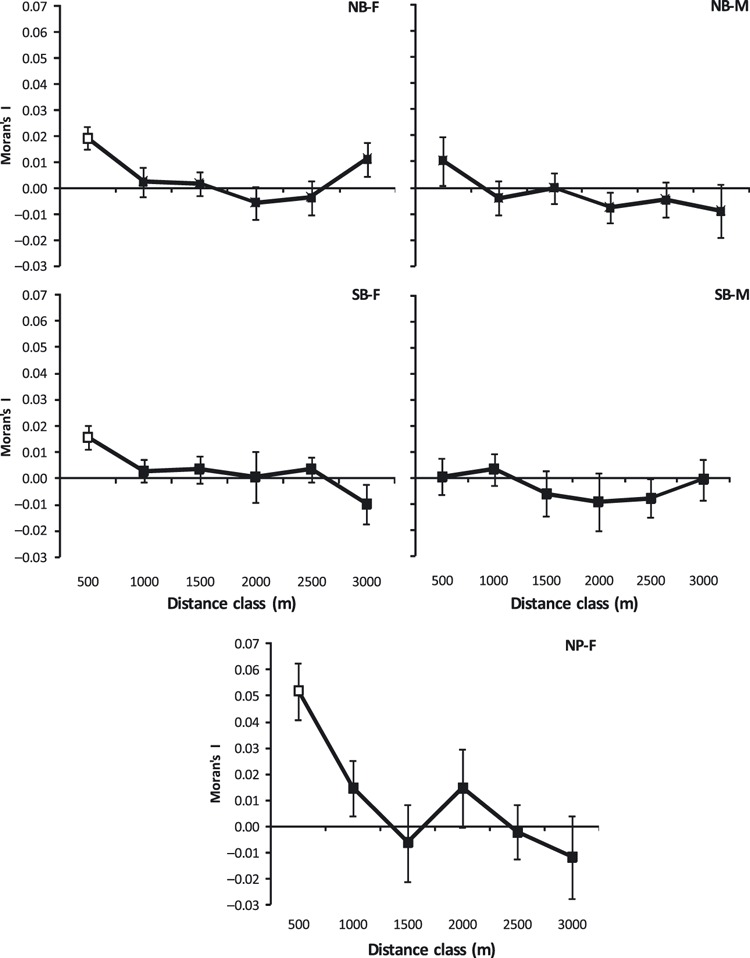
Moran's I among female and male white-tailed deer in the North Border (NB – top graphs), in the South Border (SB – middle graphs), and females in Nipawin (bottom graph). Open symbols indicate significant values >0 following a progressive Bonferroni correction. Jackknife estimates of standard error are shown.