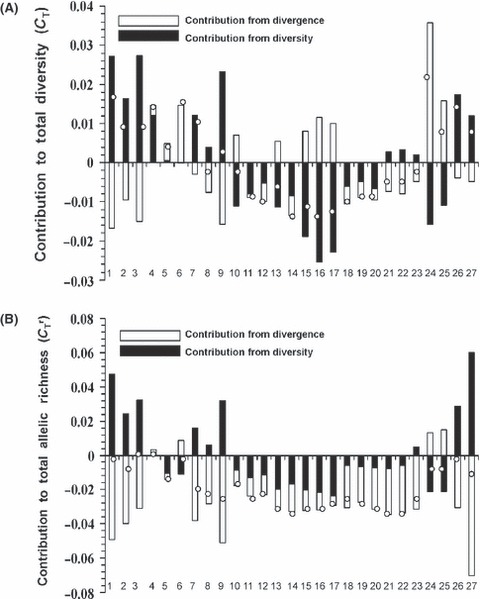
Figure 4.

Contribution to (A) total microsatellite diversity (CT) and (B) total allelic richness (CTr) of each population of rainbow trout (Oncorhynchus mykiss), decomposed into a within population diversity (black bars) and among population divergence (white bars) component. The open circle indicates the total diversity/allelic richness of each population. The numbers 1–27 represent populations as ordered in Table 1.
