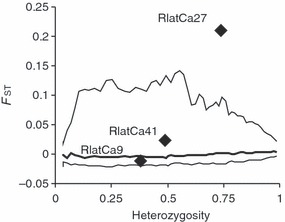
Figure 3.

Individuation of loci under selection using Fdist2: plot of FST values against heterozygosity estimates (Beaumont and Nichols 1996) for the comparison tadpoles/metamorphs. Each diamond represents a microsatellite marker; the intermediate line is the expected median; upper and lower lines are the limits of the 99% envelope.
