
Figure 3.
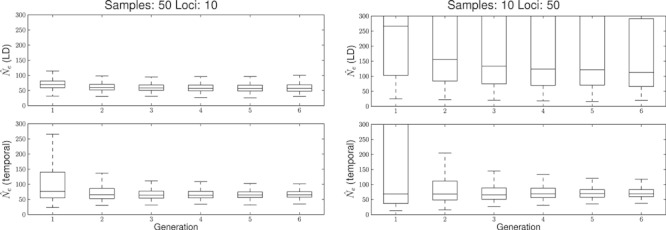
Boxplot of the  during the first five generations of a bottleneck from N1 = 300 to N2 = 50. The left column depicts a sample size of 50 and 10 loci and the right column 10 individuals and 50 loci. Top row is the linkage disequilibrium (LD) method and bottom row, the temporal method.