
Figure 2.
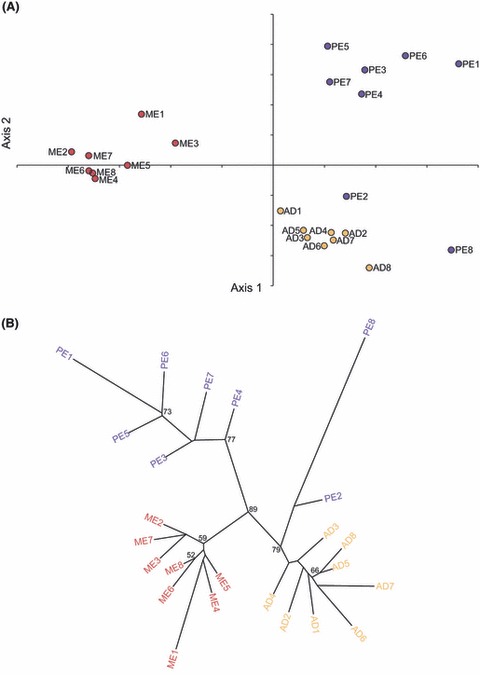
(A) Principal component analysis based on allelic frequency data at 10 microsatellite loci for Linepithema humile nests in Melbourne, Adelaide and Perth. The proportion of inertia for both axes are significant (axes 1 and 2: P = 0.0005) and explain 35.61% and 32.41% of the variance, respectively. Levels of significance were derived from 2000 iterations. (B) Consensus of 2000 additive trees based on Cavalli-Sforza chord measures to depict relationships among Linepithema humile nests in Melbourne, Adelaide and Perth (nodal values are the percentage of bootstraps >50% in which the relevant grouping occurred).