
Figure 4.
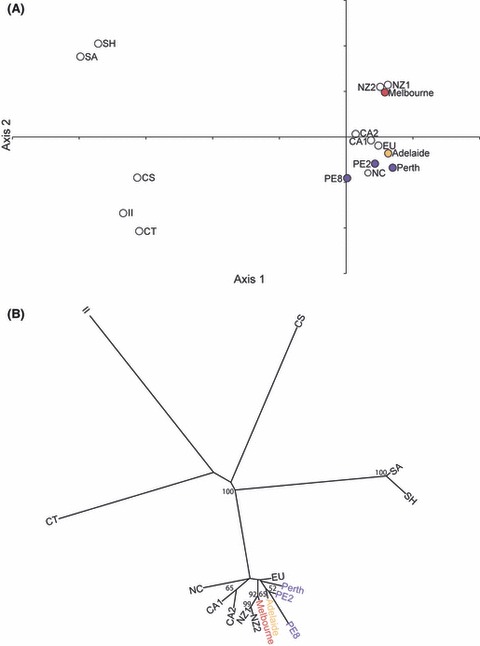
(A) Principal component analysis based on allelic frequency data at 11 microsatellite loci for Linepithema humile nest groups in Australia and populations from the native range and other introduced ranges. Perth nests were separated (Perth, PE2 and PE8) based on BAPS. The proportion of inertia of the first axis is significant (P = 0.0035) and explains 36.76% of the variance in the data. The second principal component (16.30%) is not significant (P = 0.490). Levels of significance were derived from 2000 iterations. (B) Consensus of 2000 additive trees based on Cavalli-Sforza chord measures to depict genetic relationships between Linepithema humile nest groups in Australia and populations from the native range and other introduced ranges (nodal values are the percentage of bootstraps >50% in which the relevant grouping occurred).