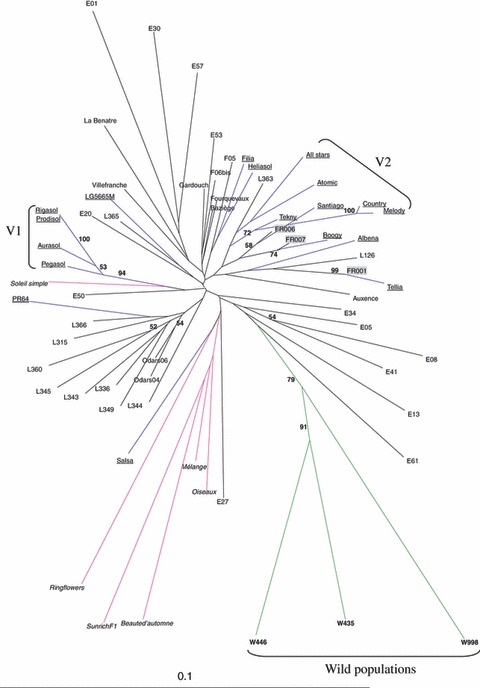
Figure 5.

Consensus neighbour-joining tree depicting the relationships between sampled natural populations and varieties, based on Cavalli-Sforza's genetic distance. Percentages on each branch indicate the proportion of bootstrap replicates in which the two sets separated by that branch appear. Only values over 50 are reported. Italics: ornamental varieties. Underlined: conventional varieties. Shadowed: volunteer populations. Bold: American wild populations. Other: weedy populations. V1, V2: cluster of varieties sold by the same seed company (see text).
