
Figure 2.
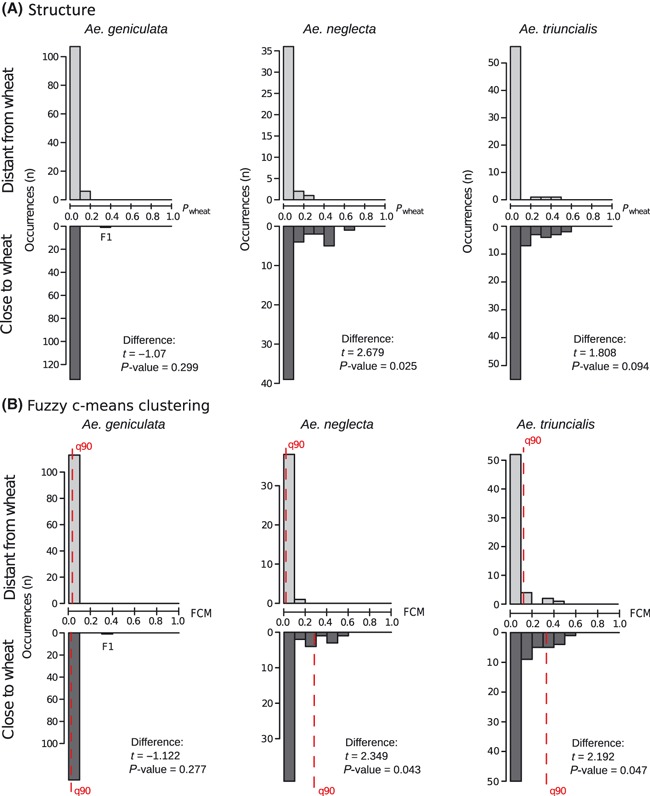
Distribution of admixture proportions for the surveyed Aegilops individuals, based on (A) the admixture proportions of fuzzy c-means clustering (FCM) and (B) wheat assignment probabilities (Pwheat, computed using STRUCTURE), according to the proximity of Aegilops individuals to wheat cultivations. Statistical differences between individuals collected close to wheat fields (i.e. closer than 50 m from cultivation) and those collected in wheat distant areas (i.e. located at more than 50 m from cultivation) were tested using generalized linear mixed models of which results and P-value are reported (binomial distribution, logit link, the effect of population origin was removed by declaring it as a covariable). The Aegilops geniculata × Triticum aestivum F1 hybrid detected on morphological grounds is highlighted. For FCM results, the 90% quantile of admixture proportions (q90) is indicated.