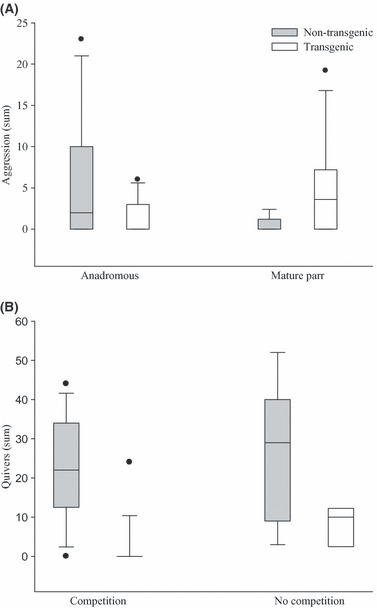
Figure 2.

Standard box plot frequencies of (A) overt aggressive behaviours by transgenic and nontransgenic anadromous and parr males during paired competitive breeding trials and (B) quivering by transgenic and nontransgenic anadromous males during the competitive and noncompetitive phases. For graphical purposes, these data were standardised to a 90-min observation period. The top and bottom of each box represent the upper (75%) and lower (25%) quantiles, respectively. The horizontal line within each box indicates the median. The vertical lines (whiskers) extending from the upper and lower quantiles represent the maximum and minimum values of the distribution, excluding the outliers. The outliers are represented by the dots located beyond the maximum and minimum whiskers.
