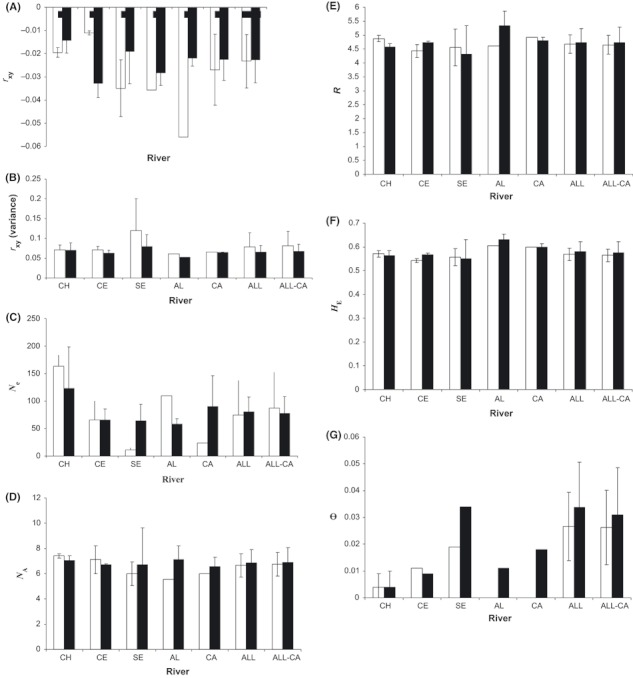
Figure 2.

Average measures of population size, genetic variation, and structure in steelhead trout (Oncorhynchus mykiss) within rivers before (empty bars) and after (filled bars) the inception of hatchery supplementation using native broodstock. Based on variation of 902 samples that were genotyped at five or more of nine assayed microsatellite loci. Refer to Table 2 for population codes; ALL refers to all rivers combined; ALL-CA refers to all rivers except the Capilano River. Standard deviations given where applicable. (A) Mean relatedness (rxy); (B) Variance in rxy; (C) Effective population size (Ne); (D) Mean number of alleles (NA); (E) Allelic richness (R); (F) Gene diversity (HE); (G) FST (θ).
