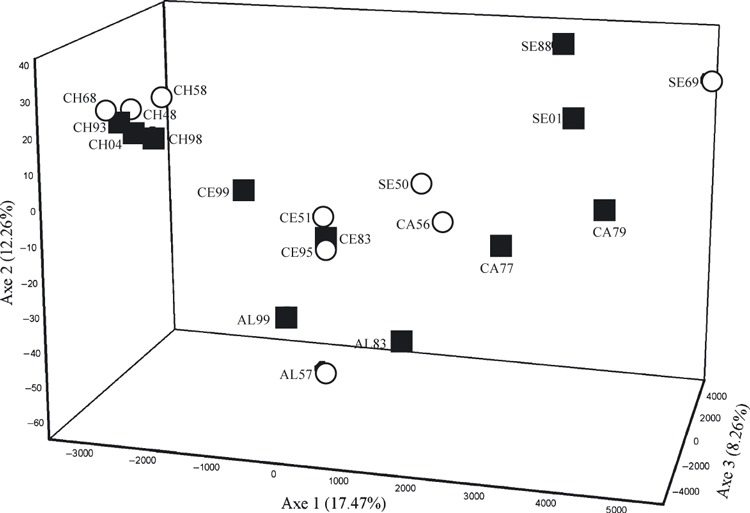
Figure 3.

Plot of mean factorial correspondence scores along the first three axes for time point samples of 902 steelhead trout (Oncorhynchus mykiss) based on variation at five or more of nine assayed microsatellite loci. Refer to Table 2 for population codes. The status of time points highlighted as before (empty circles) or after (filled squares) the initiation of hatchery supplementation using native broodstock.
