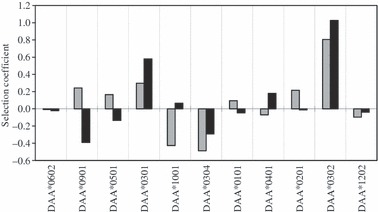
Figure 4.

Selection coefficients for Sasa-DAA alleles in salmon surviving at 6 months in their natural environment as parr (grey bars) and at 2 years as migrants (black bars). The selection coefficients are derived from allelic point estimates calculated by fitting observed and expected genotype frequencies to model H01 (see text for details). Alleles are ordered left to right with increasing frequency in eggs. DAA*0601 is not included in the graph as it was used as the baseline in the model, against which all other selection coefficients were measured.
