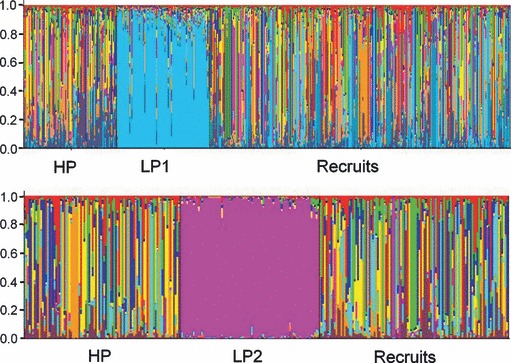
Figure 4.

Genetic structure of experimental population. Output of STRUCTURE analyses. In 2005, the most likely number of clusters (K) was 12 (top); in 2006, the most likely number of clusters was 8 (bottom). In both years, these analyses identified a primary low-predation genetic cluster, and multiple high-predation genetic clusters. Each experimental individual (parents and recruits) is represented by a single vertical line. These lines are partitioned into colored segments which represent that individual's estimated membership fraction in a particular genetic cluster (Q-value).
