
Figure 5.
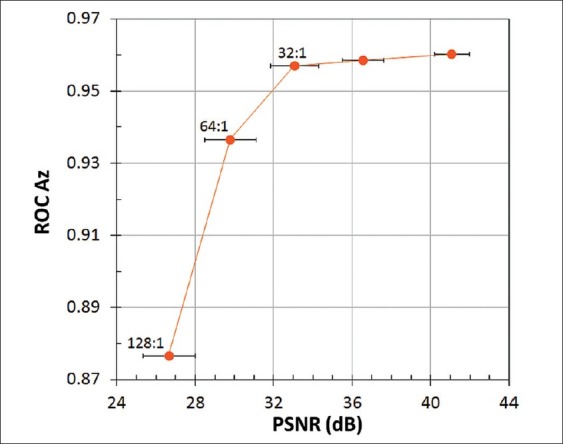
Correlation between ROC observer performance and PSNR, averaged for 100 test images at each compression ratio. Error bars show the standard deviations
Official websites use .gov
A
.gov website belongs to an official
government organization in the United States.
Secure .gov websites use HTTPS
A lock (
) or https:// means you've safely
connected to the .gov website. Share sensitive
information only on official, secure websites.
Correlation between ROC observer performance and PSNR, averaged for 100 test images at each compression ratio. Error bars show the standard deviations