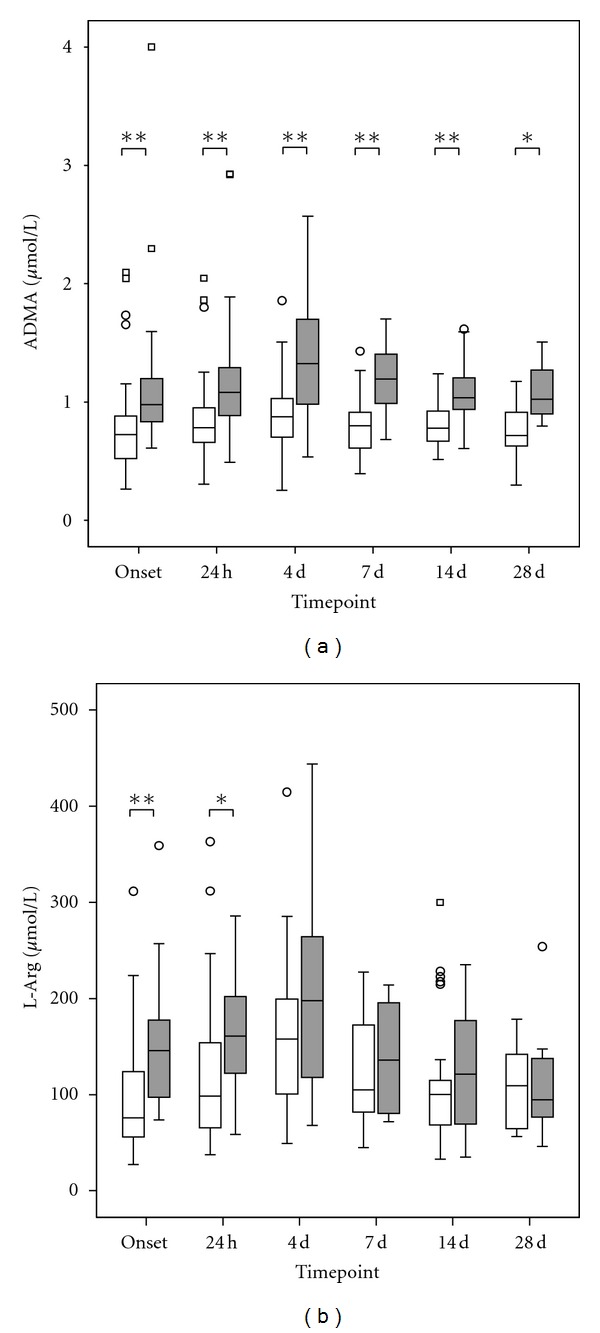
Figure 2.

Comparison of ADMA (a) and L-arg (b) measurements in plasma samples of septic patients with an ALF (n = 15, grey box) in comparison to septic patients with a preserved liver function (n = 45, white box). Data in box plots are given as median, 25th percentile, 75th percentile, and the 1.5 interquartile range. Outliers are shown in form of circles (1.5–3 interquartile ranges above 75th percentile or below 25th percentile) or rectangles (>3 interquartile ranges above 75th percentile or below 25th percentile). Concerning symbolism and higher orders of significance: P < 0.05: *, P < 0.01: **, P < 0.001: ***, n.s.: not statistically significant.
