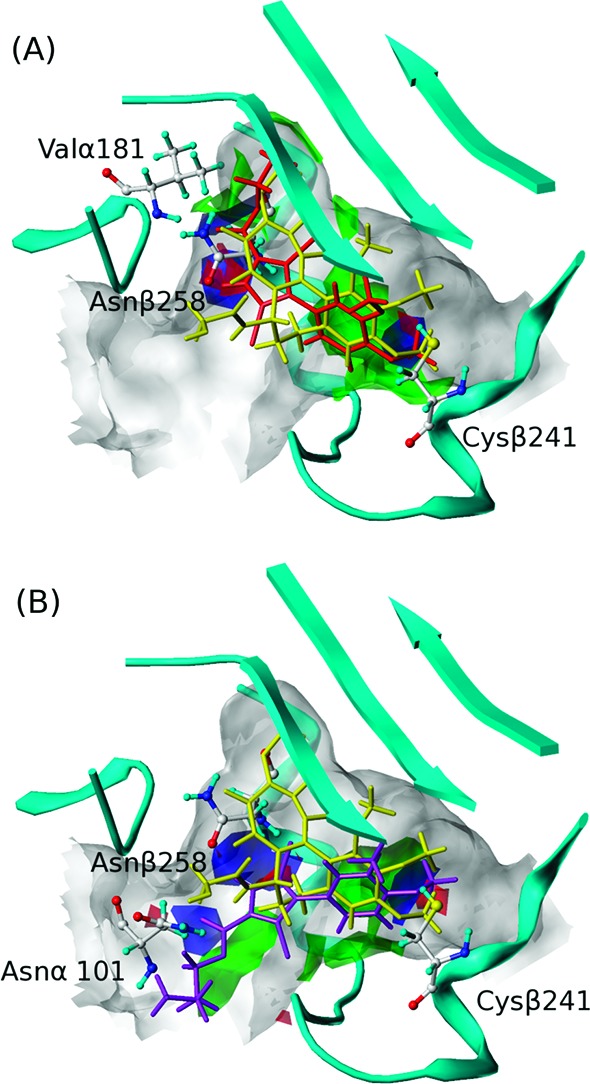
Figure 3.

HINT interaction maps of (A) 1 (binding mode I) and (B) 7e (binding mode II). For 1 and 7e, green contours represent favorable hydrophobic interactions; blue contours represent favorable polar interactions (hydrogen bonds, acid/base, Coulombic); red contours represent unfavorable polar interactions. Compound 1 is shown in red, 7e is shown in purple, and colchicine is shown in yellow.
