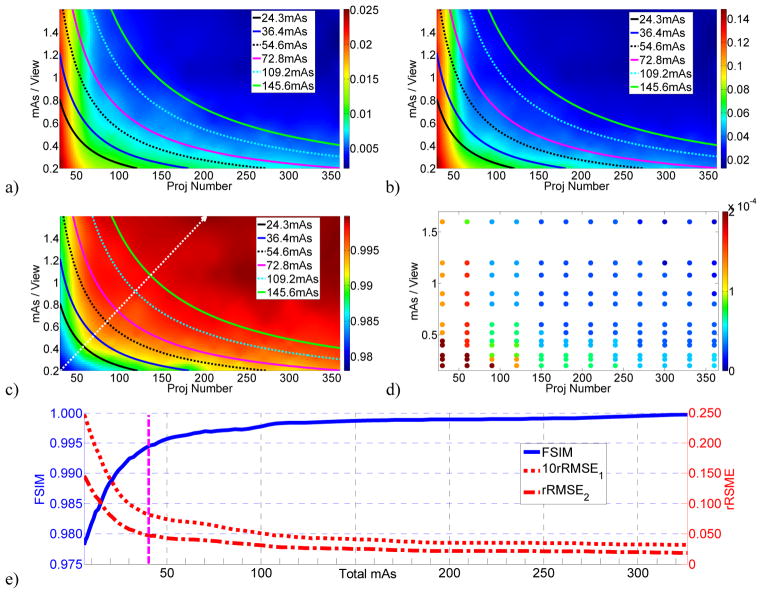
Figure 3.
Results of the simulation data. DQMs for a) rRMSE1; b) rRMSE2; c) FSIM with 6 iso-dose lines at total mAs levels of 24.3, 36.4, 54.6, 72.8, 109.2, and 145.6. The white dot line with arrow head in c) indicates the steepest image quality variation direction. d) The optimal β values for different data points. e) The variation of the IQA scores with the total mAs, along the white dot line in c). The pink dashed vertical line indicates 40 total mAs below which the IQA scores degrade at a steeper rate.

