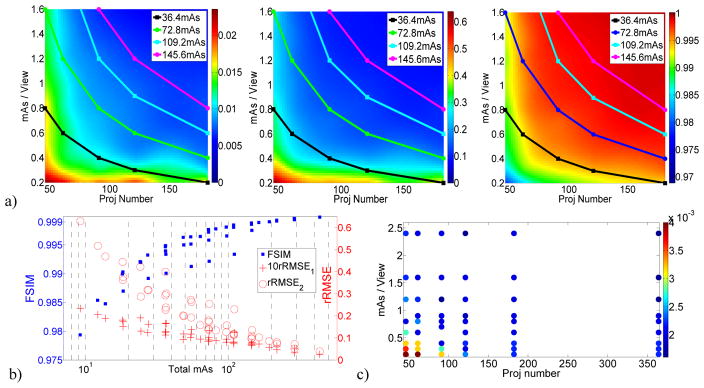
Figure 4.
Results of the measurement data. a) From left to right: DQMs for rRMSE1, rRMSE2, and FSIM with data points at four iso-dose lines around 36.4, 72.8, 109.2, and 145.6 total mAs. b) The variation of the IQA scores with dose decreasing from 576 to 6 total mAs; c) The optimal β values for different data points.

