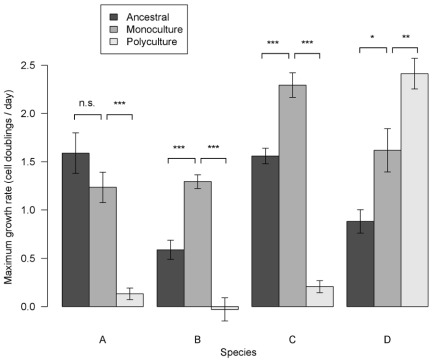
Figure 2. Maximum growth rates of isolates after evolution under each diversity treatment.
Maximum rate of growth from low densities, VMAX, of each species grown on unused beech tea under assay conditions. Dark bars, growth rates of ancestral isolates. Mid grey bars, growth rates of monoculture isolates. Pale bars, growth rates of polyculture isolates. Standard error bars are shown. Tukey Honest Significant Difference test contrasts between treatments: *** p<0.001, ** p<0.01, * p<0.05; n.s., not significant (see also Table S4). Species A evolved slower maximum growth rates in polycultures compared to its ancestral and monoculture isolates. Species B and C evolved faster maximum growth rates on unused beech tea in monocultures, but far slower maximum growth rates in polycultures compared to ancestral isolates. Species D evolved faster maximum growth rates in monocultures compared to its ancestral isolate and even faster maximum growth rates in polycultures.

