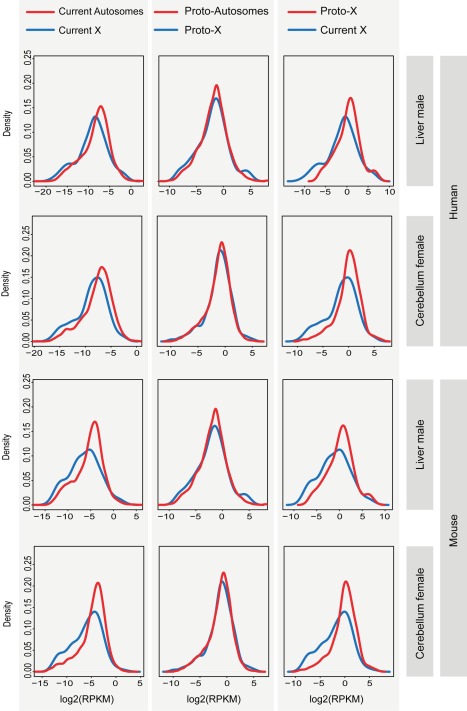
Figure 4. Distributions of current and inferred ancestral expression levels of genes on the eutherian (proto) X chromosomes and autosomes.
Distributions of expression levels of (proto) X-linked genes (blue line) and (proto) autosomal genes (red line) are shown for cerebellum and liver from human and mouse. Expression levels in the comparison of the current X and proto-X (right plots) are normalized by the respective autosomal expression levels. Gene expression level distributions for the X are significantly shifted towards lower values compared to those for autosomes (Benjamini-Hochberg p<0.05; corrected Komolgorov-Smirnov test). Also, gene expression level distributions for the current X are significantly shifted towards lower values compared to those for the proto-X (Benjamini-Hochberg p<0.05; corrected Komolgorov-Smirnov test). The distributions for the proto-X and proto-autosomes are not significantly different from each other (Benjamini-Hochberg p>0.05; corrected Komolgorov-Smirnov test). See Table S1 for all tests of differences between X and autosomal expression distributions (all tissues from all species).

