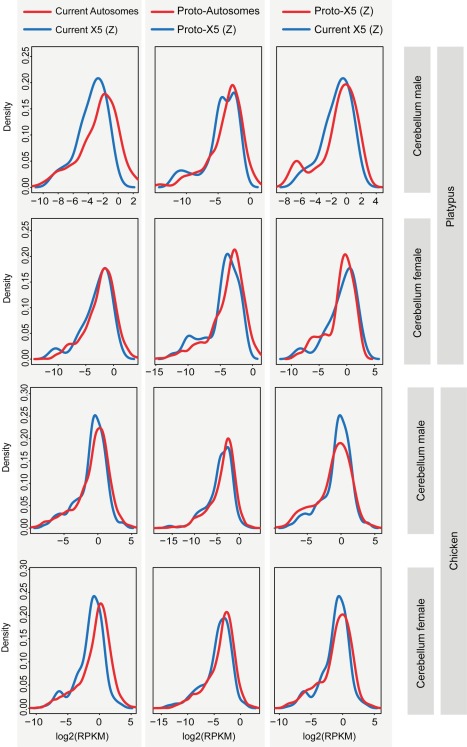
Figure 8. Distributions of current and inferred ancestral expression levels of genes on the platypus (proto) X chromosomes/autosomes and chicken (proto) Z chromosome/autosomes.
Distributions of expression levels of (proto) sex chromosome-linked genes (blue line) and (proto) autosomal genes (red line) are shown for cerebellum from platypus and chicken. Expression levels in the comparison of the current X (Z) and proto-X (Z) are normalized by the respective autosomal expression levels (rightmost plots). See Table S1 for all tests of differences between X (Z) and autosomal expression distributions (all tissues).

