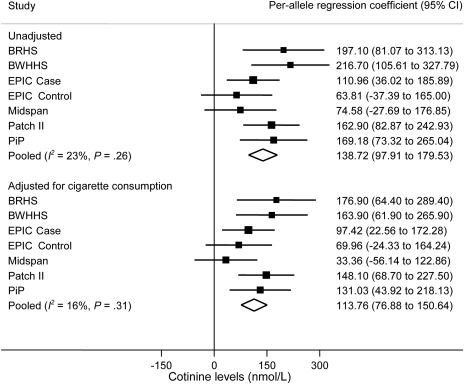
Figure 2.
Meta-analysis of association of rs1051730–rs16969968 risk allele with cotinine levels in current smokers. Data from six independent studies contributed to the meta-analysis. Cotinine levels and self-reported cigarette consumption differed in current smoker case subjects (EPIC Case) and control subjects (EPIC Control) in the EPIC study, so they were analyzed separately. In each study, linear regression was used to calculate per-allele association of rs1051730–rs16969968 genotype with cotinine levels. Units represent nmol/L. Unadjusted and adjusted (for cigarette consumption) analyses are shown. The I2 statistic was used to estimate the percentage of total variation in study estimates resulting from between-study heterogeneity. Individual study regression coefficients were combined using random effects methods. Squares represent per allele regression coefficient, which represents mean increase in cotinine levels per allele; size of the square represents inverse of the variance of the regression coefficient; horizontal lines represent 95% CIs; diamonds represent summary estimate combining the study-specific estimates with a random effects model; solid vertical line represents a regression coefficient of 0. P for heterogeneity was derived from the Cochran Q test (one-sided). All other statistical tests were two-sided, and statistical significance required a P value of .05 or less. BRHS = British Regional Heart Study; BWHHS = British Women’s Heart and Health Study; CI = confidence interval; EPIC = European Prospective Investigation into Cancer and Nutrition; PiP = Patch in Practice.

