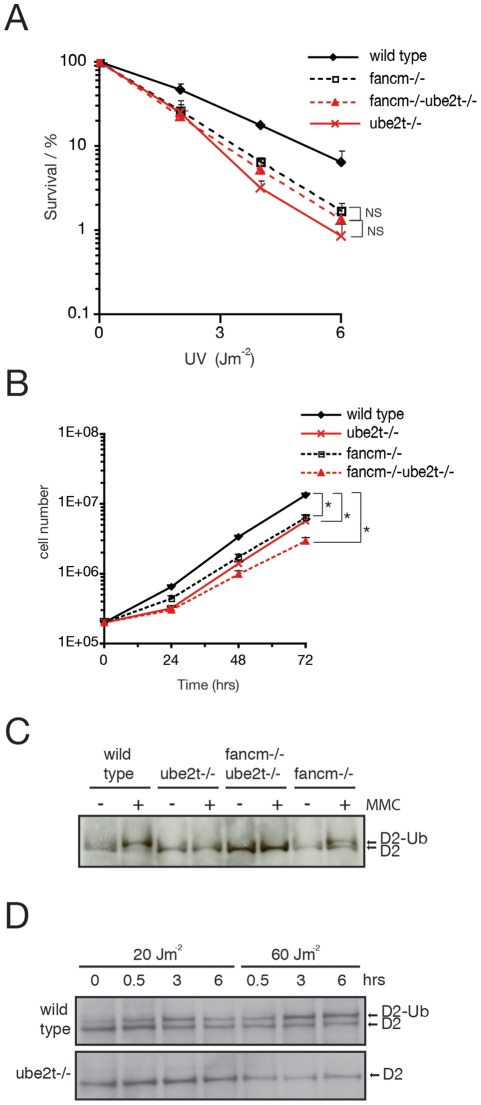
Figure 2. UBE2T and FANCM cooperate to protect cells from UV-induced damage.
(A) Colony survival of indicated cell lines after exposure to increasing doses of UV light. Error bars represent one standard error of the mean from at least three independent experiments. t-tests have been performed for indicated survival curves. P≥0.05 not significant (NS); (B) Exponential growth curve of indicated cell lines. Cell density measurements were carried out over a 72 hr time period. Error bars represent one standard error of the mean from at least two independent experiments that were performed in duplicate. t-tests have been performed for indicated growth curves with calculated P values P≤0.05 (*); (C) Immunoblot analysis to monitor MMC-induced FANCD2 monoubiquitylation. Cells were mock treated (−) or exposed to 150 ng/ml MMC (+) for 18 hrs and whole cell lysates were probed for FANCD2 by immunoblotting. Monoubiquitylated FANCD2 resolves as a slower migrating band (indicated by D2-Ub). (D) Immunoblot analysis to monitor UV light-induced FANCD2 monoubiquitylation. Cells were irradiated with indicated doses of UV light and allowed to recover for 0, 0.5, 3 and 6 hrs. Whole cell lysates were probed for FANCD2 by immunoblotting.

