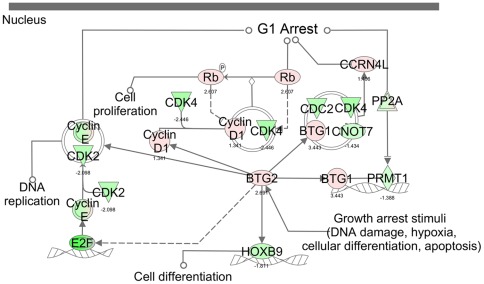
Figure 6. The biological relevant pathways: Cell cycle regulation by BTG proteins.
The dataset was analyzed by the Ingenuity Pathways Analysis software (Ingenuity® Systems, www.ingenuity.com). The color indicates the expression level of the genes (red indicating up-regulated genes and green indicating down-regulated genes).

