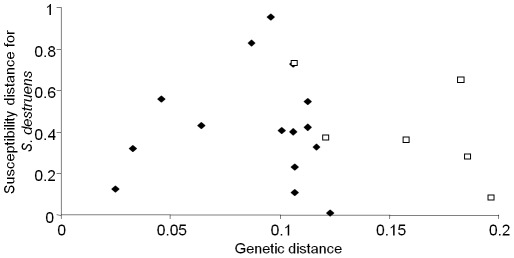
Figure 3. Host phylogeny and susceptibility to Sphaerothecum destruens.
Genetic distance between all known susceptible species to S. destruens was plotted against the susceptibility distance to Sphaerothecum destruens for all the species combinations. The two families, Cyprinidae (□) and Salmonidae (♦) show different relationship patterns between genetic and susceptibility distances. Genetic distances were based in the pairwise analysis of ten Cytochrome b sequences. Analyses were conducted using the Tajima-Nei [30] method in MEGA4 [31]. All positions containing gaps and missing data were eliminated from the dataset. There were a total of 249 positions in the final dataset.

