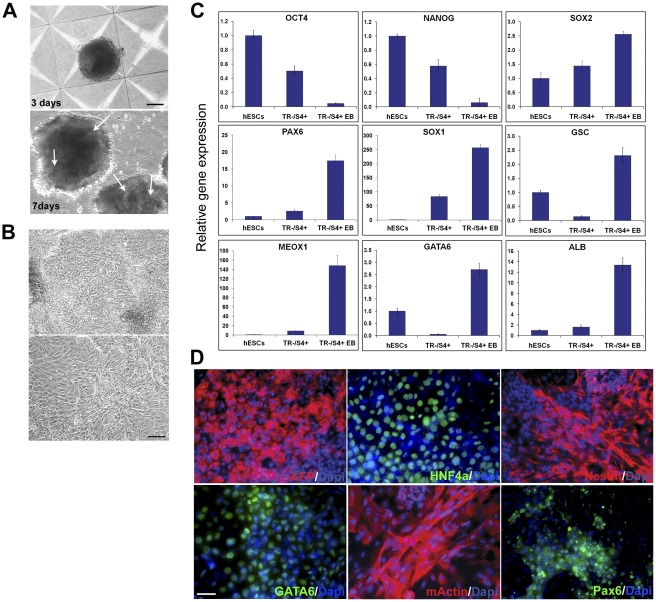
Figure 5. Differentiation of TR−/S4+ cells by cell aggregate formation.
(A) Images of cell aggregates at day 3 and 7 of differentiation, respectively. EB-like structures are visible by day 7 (arrows). Scale bar = 100 µm. (B) Images of cell aggregates cultured for a further 7 days after disassociation. Scale bar = 100 µm. (C) qRT-PCR analysis of markers in hESCs, TR−/S4+ and their differentiated progeny (TR−/S4+ EB) two weeks after initiation of differentiation (1 week in suspension and 1 week after dissociation onto adherent dish). (D) Immunostaining with indicated antibodies on differentiated progeny of TR−/S4+ cells 1 week after dissociation onto coverslip. Scale bar = 50 µm.

