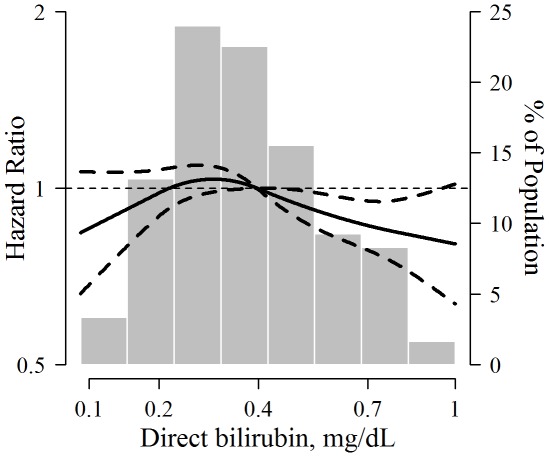
Figure 2. Multivariable-adjusted hazard ratio (95% confidence interval) for non-alcoholic fatty liver disease by concentration of serum direct bilirubin.
Risk trends were estimated using restricted quadratic splines with knots at the 5th, 50th, and 95th percentiles of the direct bilirubin distribution (the reference value with hazard ratio = 1 was set at the 50th percentile). The horizontal dotted line indicates a hazard ratio of 1. The spline regression model was adjusted for age, BMI, smoking, alcohol intake, exercise, HDL cholesterol, triglycerides, glucose, insulin, and uric acid. The histogram represents the frequency distribution of direct bilirubin concentrations in the study population.

