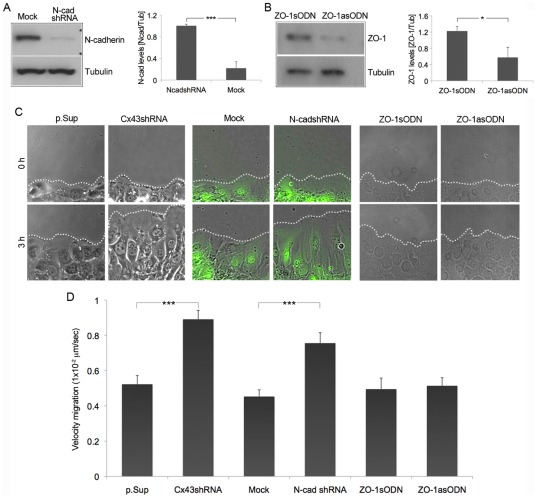
Figure 4. Cx43 and N-cadherin knockdown accelerates the rate of fibroblast migration.
(A and B) N-cadherin and ZO-1 expression was evaluated by Western blot in Mock or N-cadshRNA-transduced cells, and in ZO-1asODN or sense-treated (ZO-1sODN) cells, respectively. Values represent mean ± SD (n = 3, ***p<0.005; n = 3, *p<0.05). (C) Cx43shRNA and p.Sup cells, Mock and N-cadshRNA cells, or fibroblasts treated with ZO-1sODN and ZO-1asODN were allowed to migrate into a wound for 3 h. Pictures of cells at the beginning of the migration recording (0 h) and at the end (3 h) are shown. (D) The graph shows the velocity of migration for all the aforementioned conditions. Values represent mean ± SEM (***p<0.005).

