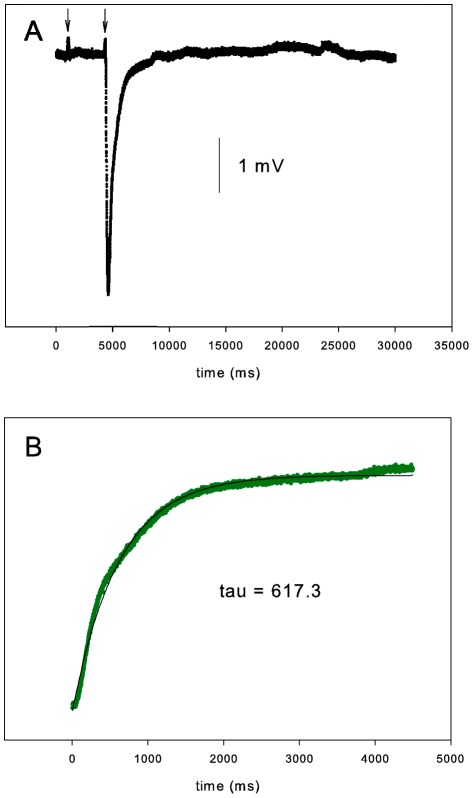
Figure 1. Control EOG.
(A) At the first arrow, a 100-ms stimulus of unodorized air was applied to the turbinate. At the second arrow, a 100-ms stimulus of isoamyl acetate was applied. The amplitude was 4.4 mV. (B) The first 4500 ms of the recovery from the minimum of the EOG in A are plotted (green) along with a regression curve (black; y = Ae −t/τ+c). The R2 for the fit was 0.993 and the time constant of the recovery, τ, was 617 ms.

