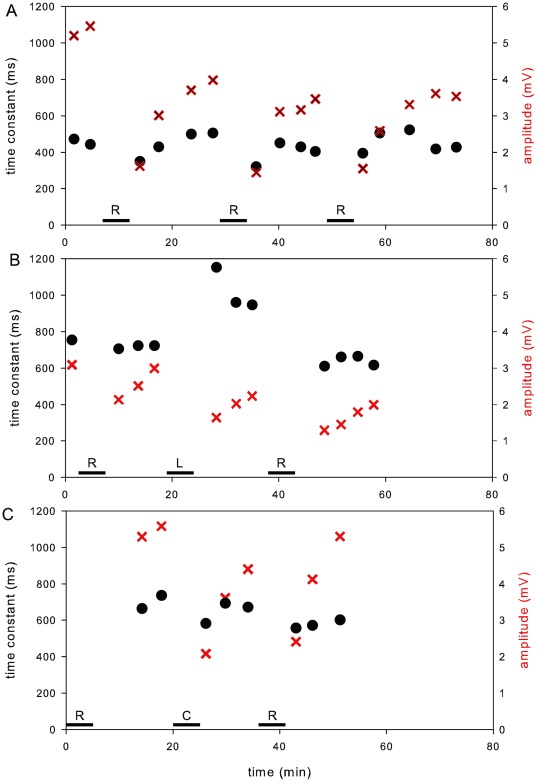
Figure 2. EOG changes over time.
The EOG was recorded before and after each of several treatments. Each treatment consisted of applying solution to the tissue for about 5 min (horizontal bars). The amplitudes of the EOG (X's) and the time constants (filled circles) were measured and plotted. (A) 3 repeated treatments with control Ringer (R). The EOG amplitudes transiently decreased after each treatment while the time constant changed little. (B) The EOG was recorded before and after a Ringer treatment (R), then treatment with a Li+-replaced Ringer (L), and then after rinsing the tissue with Ringer and a Ringer treatment (R). The Li+-replaced Ringer caused an increase in the time constant. (C) The EOG was recorded after a Ringer treatment (R), then treatment with Ringer containing 100 µM caloxin (C), and then after rinsing the tissue with Ringer and a subsequent Ringer treatment (R). The time constant changed little after caloxin treatment.

