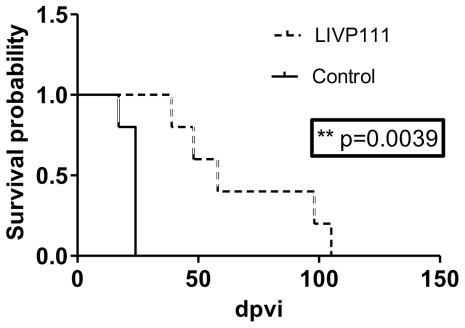
Figure 5. Survival curves of LIVP1.1.1-treated and non-treated STSA-1 tumor-bearing mice.
The comparison of the survival between the different treatment groups (n = 5) was statistically evaluated by Kaplan-Meier and log-rank (Mantel-Cox) tests (GraphPad Prism, San Diego, CA). P<0.05 was considered statistically significant. ** P = 0.0039.

