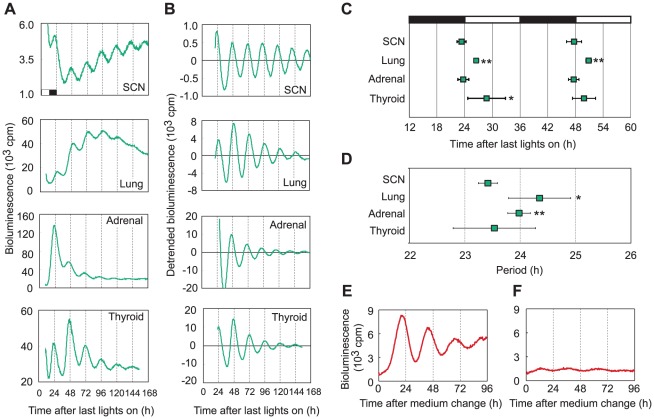
Figure 1. Bmal1-driven bioluminescence rhythms of transgenic mouse tissues and fibroblasts.
(A) Representative bioluminescence recordings of SCN, lung, adrenal gland, and thyroid gland tissues from Bmal1ELuc-A1 mice. The x axis indicates the time after the last lights on. (B) Data shown in (A) were detrended to reduce noise and baseline trends, as described in Materials and Methods. Clear circadian rhythms were observed in each tissue. (C) Average peak times (means ± SD) were plotted against the time after the last lights on. Peaks were determined from the detrended data. (D) Average periods (means ± SD). The average phase and period were determined for SCN (n = 6), lung (n = 10), adrenal gland (n = 10), and thyroid gland (n = 6) tissues. One or two explants were obtained from each animal. (E–F) Representative bioluminescence recordings of Bmal1-RED fibroblasts after dexamethasone treatment (E) and without dexamethasone treatment (F). Open bar, the previous light period. Filled bar, the previous dark period. cpm, counts per minute. Bars indicate SD. *: P<0.05, **: P<0.01, Kruskal-Wallis H-test followed by Mann-Whitney U-test with Bonferroni correction. Data were compared with SCN. Adrenal, adrenal gland. Thyroid, thyroid gland.

