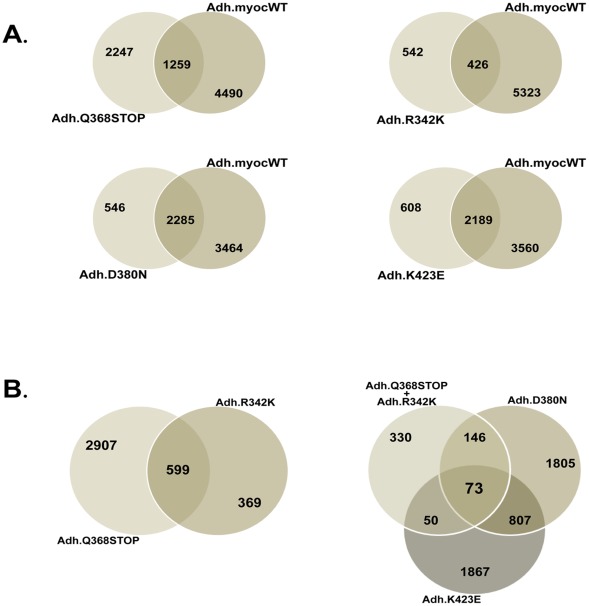
Figure 6. MYOC mutants shared different gene percentages with MYOC wild-type, and shared 73 genes among themselves.
Venn diagrams of genes differentially altered 1.5-fold in response to overexpression of MYOC wild-type and MYOC-mutants. Each circle represents one condition. Intersections indicate numbers of genes that are shared between the different conditions. A) genes shared of each of the mutants with the wild-type. B) genes shared by all mutants.

