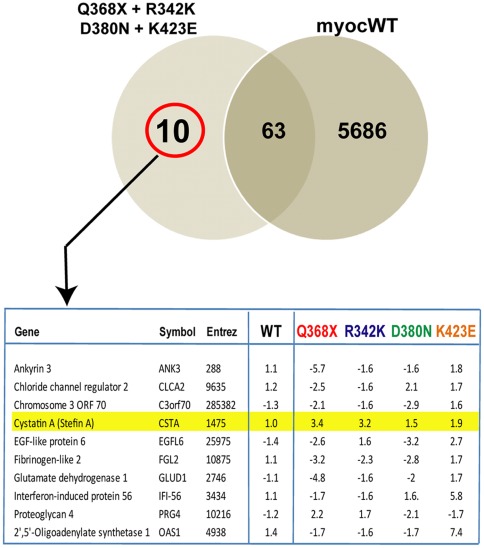
Figure 8. Cystatin A is induced in all MYOC mutants and not in MYOC wild-type.
Top: Venn diagram comparing genes altered 1.5-fold in all MYOC mutants (left circle) with those altered in the MYOC wild-type (right circle) (from Figure 6). Intersection indicates numbers of altered genes which are shared between all the mutants and those altered in the wild-type. Number of genes specifically altered by the mutants is outside the intersection and circled in red. Bottom: list of specific genes highlighting Cystatin A and its altered fold change values in each condition.

