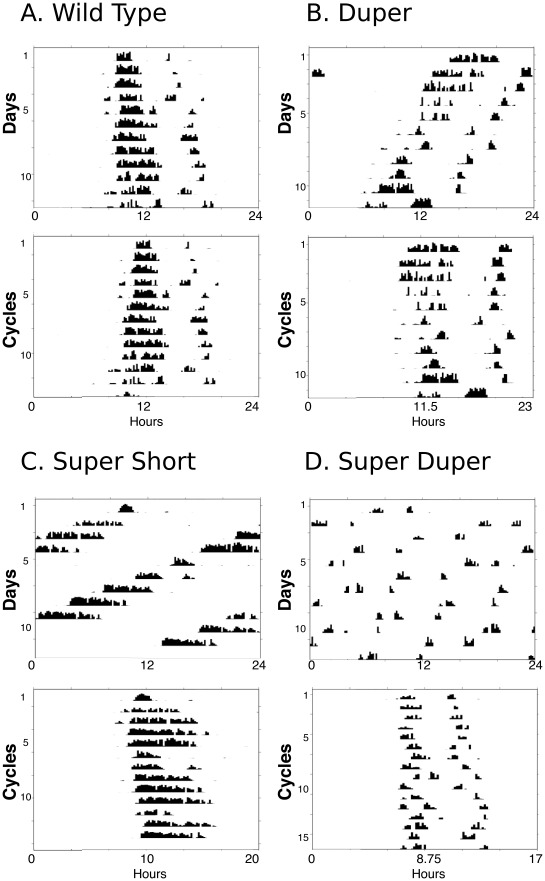
Figure 3. All strains show coherent rhythmicity despite differences in precision.
Actograms depicting locomotor activity rhythms in DD in the individuals showing the median value of circadian precision among groups of (A) TTDD, (B)TTdd, (C) ttDD, and (D) ttdd male hamsters. In each panel the top actogram is plotted modulo 24h. The same data are replotted in the bottom actogram modulo τDD.

