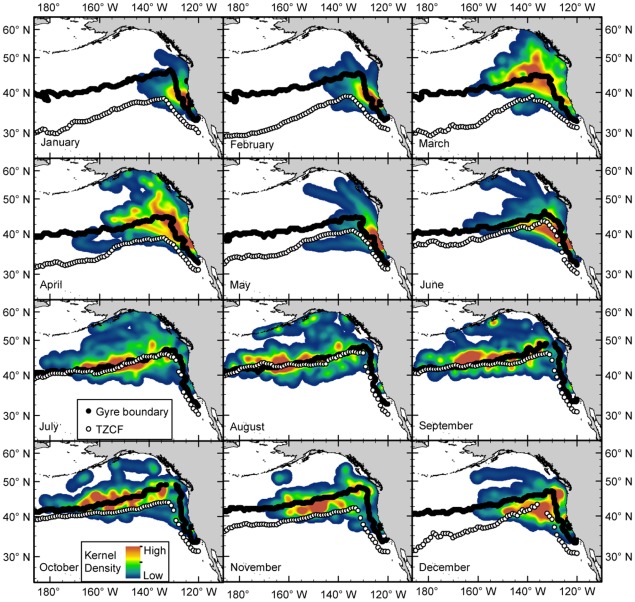
Figure 4. Monthly kernel density distribution of female northern elephant seals from the Año Nuevo, CA colony from 2004-2010.
Tracking data were regularized to hourly positions prior to analysis and only complete trips were included (n = 195). The black line shows the monthly position of the gyre-gyre boundary, estimated from the 170 cm absolute dynamic topography climatology contour. White points indicate the position of the Transition Zone Chlorophyll Front, estimated from the 0.2 mg/m3 contour. Oceanographic climatologies include data from 2004 through 2008.

