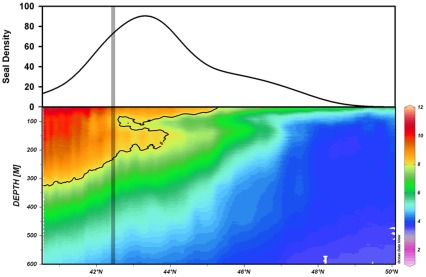
Figure 7. Temperature profile and female northern elephant seal density along a transect of the ∼163W meridian from 40N to 50N.
The temperature profile was created from TDR data between 28-July-2005 and 24-August-2005 (seal ID: 2005037; post-molting season). The 8°C isotherm, indicated with a black line, highlights the temperature inversion. The seal density was extracted from the inter-annual August kernel density (see fig. 5). The grey bar shows the position of the gyre-gyre boundary.

