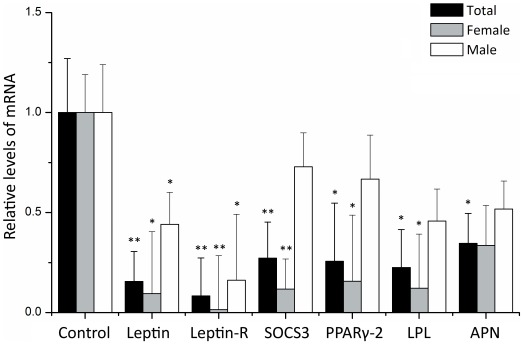
Figure 2. Relative levels of the genes in induced adipocytes from AIS group versus control group.
The expression of target genes was measured by real-time quantitative RT-PCR and normalized to GAPDH expression. Relative expression levels were calculated by using the 2−ΔΔCt method. The total group included the whole data set whereas the female and male groups included the data from each gender only. *P<0.05 was considered statistically significant. **P<0.01. All P values were calculated with age adjustment.

