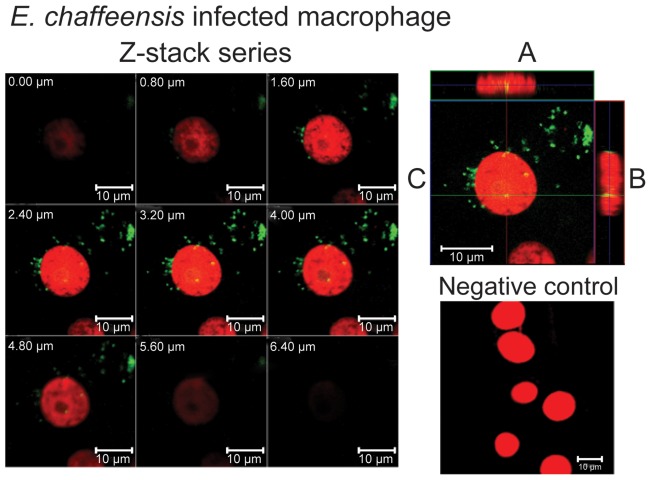
Figure 11. Confocal microscopy Z-stack imaging to localize E. chaffeensis within a host cell nucleus.
Immunofluorescent detection of E. chaffeensis was accomplished with mAb 56.5. Detection was made using Alexa Fluor 488 (green fluorescence) anti-mouse secondary antibody. Propidium iodide was used to stain nuclei (red fluorescence). Yellow fluorescence indicates E. chaffeensis localized within the nucleus. (Z-stack images collected at 0.8 µm sections were presented in the top left panel of the figure. The cell sections in the figure were identified with the section depth at the top left on each image. The magnification in each cell section was presented at the bottom right of each image by placing a 10 µm scale bar.) In top right panel; A is Z-projection in the X–Z direction, B is Z-projection in the Y–Z direction and the blue lines in A and B indicate the Z-depth of the 3.20 µm optical slice in C. The green and red lines in C indicate the orthogonal planes of the X–Z and Y–Z projection, respectively. Uninfected cells which were subjected to similar immunofluorescence analysis were used to serve as a negative control for this experiment (bottom right panel).

