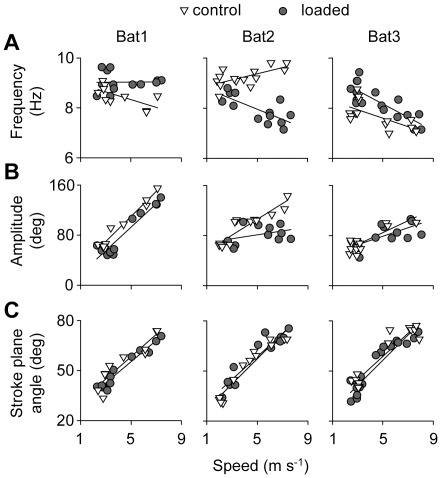
Figure 2. Wing motion parameters for bats in control and loaded conditions.
Relationship between wingbeat frequency (A), wingbeat amplitude (B), and stroke plane angle (C) with flight speed. Open triangles represent control flights, grey circles represent loaded flights. Each point represents the mean value for a particular trial, using both wind tunnel and flight corridor flights.

