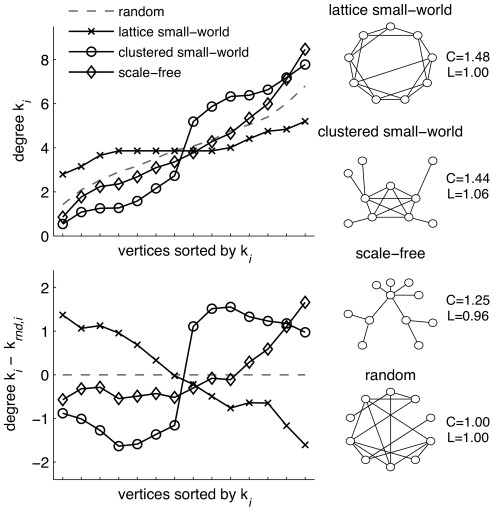
Figure 1. Degree distributions of prototypical networks.
Right column shows illustrations of prototypical networks: the (ring) lattice small-world, the clustered small-world, and the scale-free network. Note that all ordered networks have small world properties as C>1.0 and L∼1.0, albeit to a different degree. Random networks serve as baseline for all comparisons (C = 1.0 and L = 1.0). From the three types of ordered networks, graphs (number of vertices: N = 14, average degree = average number of connections per vertex: K = 4.0) were simulated with three random reconnections to ensure small-world properties. The resulting degree distribution holds the number of connections sorted low to high (Top left plot) with the dashed line representing the average of 1000 randomized graphs. The three types of ordered graphs show highly distinctive degree distributions when plotted relative to the random graph (bottom left plot). Lattice small-world networks have relative flat degree distribution (around 4) resulting in a negative slope when compared to random networks. Clustered small-world networks have one set of vertices with low degree, another with high degree resulting in a rotated-S-shaped curve. Scale-free networks have a exponentially increasing curve in their degree distribution.

