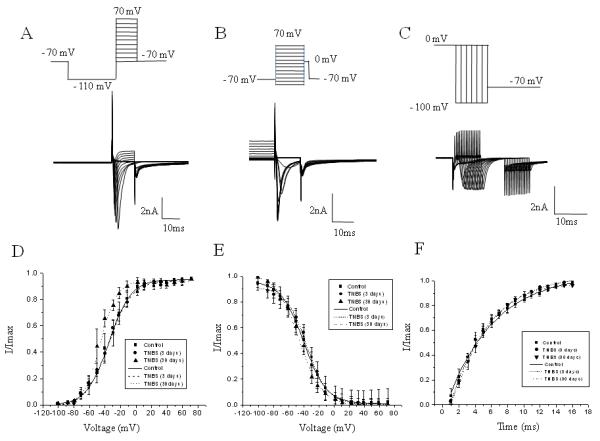
Figure 3. Kinetics of Na+ channels recorded from bladder DRG neurons in rats with TNBS-induced colitis.

A, The protocol (top panel) of steady-state activation and raw traces (bottom panel) of total Na+ current. The steady-state activation of VGSC was assessed by using a three-pulse protocol with a negative pre-pulse to −110 mV and a series of short pulses of 10 ms duration from −110 mV to +70 mV to activate Na+ currents. B, The protocol of steady-state inactivation and raw traces of total Na+ current. The amplitude of steady-state inactivation was measured at 0 mV after 150 ms depolarizing pulses ranging from −100 mV to 70 mV. C, The protocol of recovery from inactivation and raw traces of total Na+ current. The time course of recovery from inactivation was assessed using a 100 ms pre-pulse to −100 mV from the membrane holding potential of −70 mV. Na+ channels were then inactivated by a 100 ms conditioning pulse to 0 mV, and the membrane was returned to a potential of −100 mV for a variable time period (from 1 to 20 ms, 1 ms increments) before eliciting a second current with a test pulse to 0 mV in order to assess recovery of channels from inactivation after a 5 s pulse-free period at the holding potential. D, Voltage dependence of steady-state activation in bladder neurons from control and TNBS treated animals. Please note a leftward shift in the group with acute colitis. E, Voltage dependence of steady-state inactivation in lumbosacral DRG neurons. F, Time dependence of recovery from inactivation in control and experimental groups. * - p≤0.05 indicates statistical significance when compared to the control group.
